

Geographic Shapes to SVG

We're going to download some shapefiles and generate SVG elements. My goal is to create a web app for myself to use to create SVGs that can be used for games or other purposes. If you want to make something that end users can use then you will need to make several adjustments.
Setup Python Enviornment
I am going to use Python, but you could also use JavaScript or another language with good libraries to handle geographic data. The libraries for this project include shapely, fiona, and pyproj. Follow the up-to-date documentation for the install process for your computer. Other library combinations will probably work or might be required for specific tasks.
from pyproj import Transformer
from shapely.geometry import Polygon, Point, MultiPolygon
from shapely.ops import unary_union
import fiona
data = fiona.open(filename)
The data object will then have all of the data in geoJSON format for easy processing. There are lots of websites to choose from to find and download shapefiles. Natural Earth has states, countries, and more. The U.S. Census has lots of files for subregions of the country. Other formats can generally be easily converted as well with easy-to-find Python packages.
For an all-in-one solution you can spin up a Flask server or you can just create static files and open them locally.
Create SVG
Once we have read the geographic object we need to create an SVG path. We will convert to a web Mercator projection with transformer. If the geoType is MultiPolygon then you should iterate over all the polygons and create multiple paths within a group.
projectionOld = data.crs["init"]
projectionNew = "epsg:3857"
transformer = Transformer.from_crs(projectionOld, projectionNew)
#coords is the coordinates from a particular region
for ii in range(len(coords)):
    out = transformer.transform(coords[ii][1],coords[ii][0])
    out = [out[0],-1*out[1]]
If the outputted SVG is upside down, then negate the y values. If the SVG is rotated then switch the x and y corrdinates. Latitude and Longitude are often written with the y values (latitude) first and using positive values to represent up so these issues are common.
I want to shift and scale the output to fit into a viewBox with height of 100. You can use other units, but the width of strokes will also need to be adjusted. Starting at 0,0 (in the top left) makes it easier to get the SVG coordinates of the cursor, but you can also easily add offsets later. Since it is good to know the viewBox at this step, I prefer to do all the adjustments for consistency.
Flask Server
There are a lot of options that can be set to make the perfect map. If you don't want to use command line arguments or modify the code each time, you can use your browser for a friendlier UI. Starting a local server is quite simple, but if you want something public you will need to do a lot more work to make it secure, accessible, and fast.
We can read the shapefile and create a table with all of its properties so that we can examine exactly which values to use. The form can take any input you add and then post the values back to the server. I use one url point for both get and post, but you can set as many urls as you need. If you want to choose amongst several shapefiles to load then you can send a GET/POST parameter or have different urls for each file.
from flask import Flask, render_template, request, send_from_directory, redirect
app = Flask(__name__)

@app.route('/create', methods = ['GET', 'POST'])
def create():
    if request.method == 'GET':
        table = loadFileProperties(filename)
        return render_template('create.html',head=table["head"],body=table["body"])
    else:
        nameStr = request.form.get('nameColumn')
        idStr = request.form.get('idColumn')
		#lots more code
Add some JavaScript
Once the SVG element has been generated, we can add some JavaScript to make some adjustments. Most actions are relatively simple to implement and you can view the provided repls to get started.
This repl translates any shape to a more desirable location. When tracking the mouse coordinates you need to make sure you convert to correct SVG units.
This repl edits the viewBox to control which regions are visible. Set the values in the inputs or drag the sliders to the exact dimensions.
This repl copies or downloads the generated SVG so that you can use it anywhere. There are also included functions to resize, duplicate, or delete any region.
Change the fill color of a region with this repl. The final repl below also allows you to edit the color of the borders of each state.
To give each shape its own border, we can use clip-path. Define clipPaths for each state/country and then link back to them from the group. The result is nice borders that do not overlap with neighbors so that they can be colored independently. By clipping it is not possible for labels to be outside the borders so you may need to do more work if that is a concern.
{% for region in regions %} <clipPath id="clip-{{region}}">{% for path in regions[region]["paths"] %}<path d="{{path.d}}" />{% endfor %} </clipPath> {% endfor %} {% for region in regions %} <g id="region-{{region}}" clip-path="url(#clip-{{region}})" ... </g> {% endfor %}
If you want labels, then computing the centroid of each shape is a good starting point. You can perform fancier computations since geographic shapes can be really weird with centroids outside of the shape. I usually place them on the centroid and then manually move the ones that are in awkward places. This repl moves the labels and also allows you to adjust the font size.
Final Product
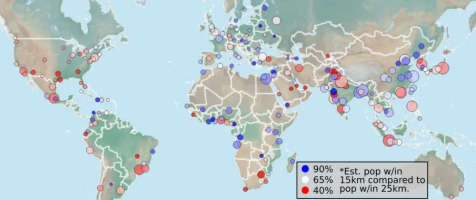
The best repl to use is here. It includes the server and comes preloaded with 3 example shapefiles. You can either fork it in Replit or download and create something on your local drive. Or just check out an example of the generated map page.
Future blog posts and videos will use these generated SVG elements in more applications.